-
Home

- Blog
Blog
- Details

As the new year begins, many homeowners and landlords start thinking about what comes next. Whether you’re considering selling your property, letting an investment, or simply exploring your options, the right advice at the right time can make all the difference.
We provide a considered, professional approach to selling and letting across Wolverhampton, Walsall, Wednesfield, Dudley, Sedgley and Willenhall. With a strong understanding of local market conditions and a focus on clear communication, we help our clients move forward with confidence and clarity.
Our team takes the time to understand your goals, offering honest guidance, carefully considered marketing and a service built on long-standing local knowledge rather than empty promises. From accurate pricing to thoughtful presentation and ongoing support, every detail is handled with care.
If a move or a new letting is part of your plans for the year ahead, we’d be delighted to have a conversation.
Contact us today to discuss selling or letting your property and start the year with a trusted local agent by your side.
- Details
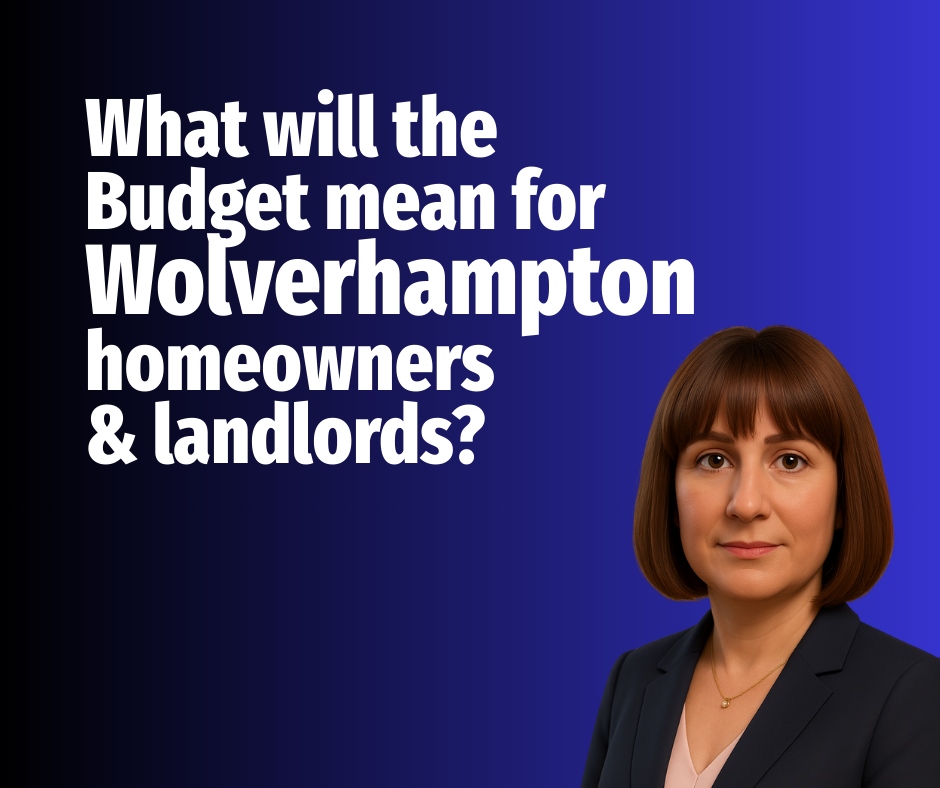
The Chancellor’s Autumn Budget has finally arrived after months of rumour, leaked ideas and speculation. Many households in Wolverhampton had braced themselves for a sweeping new annual tax on homes above £500,000. That proposal has now been dropped, which removes the biggest cloud that had been hanging over the local market. Instead, the Government has opted for a more focused approach by introducing a new high value council tax surcharge that only applies to properties valued above £2 million. Alongside this, landlords will face higher property income tax from 2027 and the wider rental sector will continue to feel the pressure created by years of rising costs, stronger regulation and increasing demand.
This report brings those national announcements into a local Wolverhampton context. It considers how the changes could influence homeowners, landlords and tenants, and where the opportunities and risks may appear in the years ahead.
The end of the feared £500,000 annual charge
For Wolverhampton, the most significant early headline is what has not happened. The much-discussed idea of an annual tax on all homes above £500,000 has been ruled out. Let us not forget that quite a few homes in the area are above that £500k threshold.
Of the 106,910 homes in the Wolverhampton area,
there are 3,819 homes worth over £500k
Removing it should strengthen confidence among homeowners who were delaying decisions to move, extend or sell because they feared a new recurring cost.
Stamp duty remains unchanged. This means that the thresholds set more than a decade ago continue to apply. In practical terms, most Wolverhampton buyers will still pay only modest stamp duty, with first-time buyers retaining the current reliefs on properties up to £300,000. The system may not be perfect, yet the absence of change avoids further friction at a time when the market needs stability rather than disruption.
The new mansion tax for homes above £2 million
From April 2028, a new high value council tax surcharge will apply to homes worth more than £2 million. It will begin with an additional £2,500 a year for properties between £2 million and £2.5 million, rising to £7,500 for homes worth more than £5 million.
Nationally, this will affect around 0.5% of homes and around 85% of those are in London and the South East.
In Wolverhampton, the scale is vastly smaller.
Of the 106,910 homes in the Wolverhampton area,
there are only 16 homes worth over £2m
(Wolverhampton area = WV1/2/3/4/6/10/11).
Buyers at the very top of the market will not welcome an extra annual bill, although for purchasers spending £5 million or more, the surcharge is relatively modest compared with stamp duty which can already exceed £500,000. For owners who bought their home many years ago and now live on a pension, any extra annual cost will feel more significant. However, the option to defer payment until a sale or death should prevent financial hardship and should also reduce the likelihood of forced sales or a sudden flood of properties coming to the market.
Higher property income tax for landlords
Landlords will face a 2% rise in the basic, higher and additional property income tax rates from April 2027. The new rates will be 22%, 42% and 47%. This follows a long list of changes over the last decade that have already reduced the returns landlords enjoy. These include cuts to mortgage interest relief, the stamp duty surcharge, the shrinking of capital gains tax allowances, and the new obligations set out within the Renters Rights Act and the energy efficiency rules.
Wolverhampton rents have increased from £677 pcm in 2020 to £986 pcm, a rise of 45.6%
However, higher rents must be understood in the context of wages. The average full-time wage in the West Midlands has risen from £554.10 per week in 2020 to £730.40 a week. Tenant affordability remains the key driver of rental values, and responsible landlords will continue to balance fair rent increases with realistic expectations of what tenants can pay. For most landlords, rising gross income has helped offset rising costs, but it has not created excess profit. That is why any change to taxation must be approached with care.
What this means for Wolverhampton tenants
Although this report is mainly for homeowners and landlords, tenants will read it too. It is important to acknowledge that they have faced the sharpest rise in living costs for a generation. The concern is that fewer landlords in the system could reduce rental supply which then pushes rents higher. A balanced market needs enough private rental homes to meet local demand. If rules or taxation become too heavy handed, the long-term effect will be fewer choices for tenants and higher rents.
What this means for Wolverhampton homeowners
For most Wolverhampton households, the Budget will feel less dramatic than many feared. The absence of a £500,000 annual charge has avoided what could have been a major distortion. The new mansion tax will touch only a tiny fraction of the local Wolverhampton market. The valuations of current band F, G and H homes will be reviewed, but this is a nationwide exercise and not a Wolverhampton specific event.
The broader outlook remains relatively steady. Forecasts suggest that UK house prices will rise from an average of 1% to 2% a year for next couple of years. That is broadly in line with expected ‘real’ wage growth.
Our final thoughts
The Budget has nudged the property market rather than shaken it. Wolverhampton homeowners have more clarity. Landlords have further costs to plan for, but also a continuing rise in demand for good quality homes to rent. Tenants continue to face pressure, yet a well-managed and well-supplied rental sector remains essential for the town.
As always, Wolverhampton’s property market will respond to these changes in its own quiet and measured way. Stable rules, rising wages and sensible pricing will be the real drivers of activity over the next few years.
- Details
If you listened to the doom merchants, you would think first-time buyers (FTB) in Wolverhampton had no chance at all. According to the loudest voices, buying a first home is impossible, the ladder has been pulled up, and the only people who buy their first homes today are lottery winners or those with wealthy parents. The story is always the same. Prices up, wages squeezed, and doors slammed shut.
Yet when you scratch beneath the surface, the facts tell a very different story. In truth, the numbers completely overturn what many people believe. They also offer something precious. Hope. Real hope, backed by evidence rather than headlines.
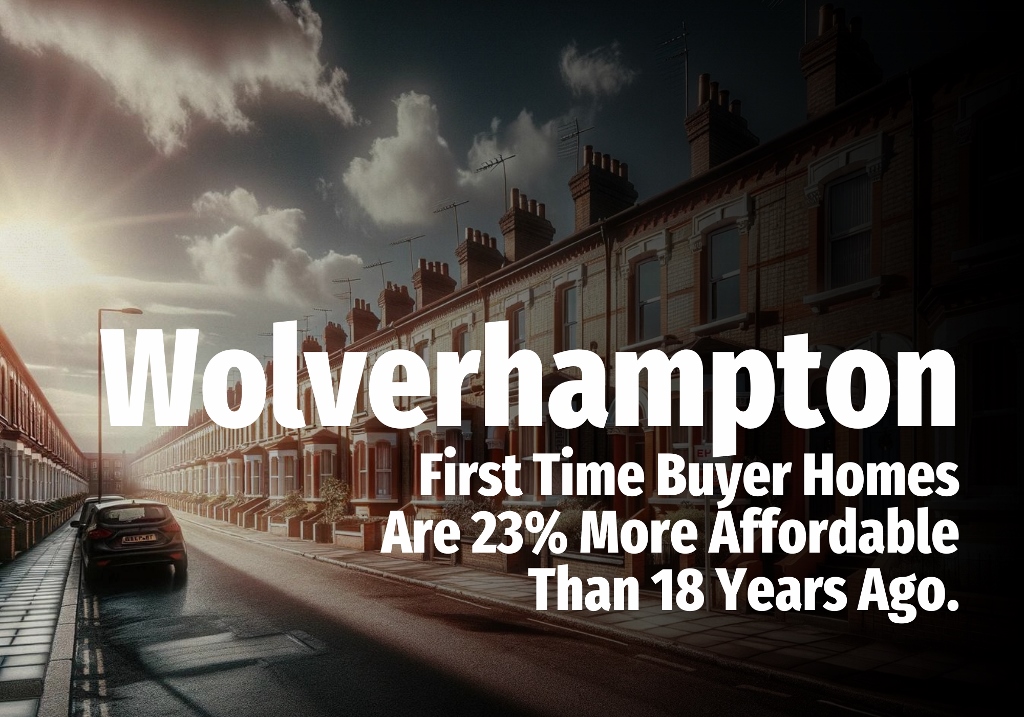
Let us start with the part that always shocks people. Wolverhampton starter homes have increased in value by 52.1% since 2007 (18 years ago). At first glance, that looks like an affordability disaster. The average first-time buyer home in Wolverhampton now sits at £155,000, and the average salary is £26,893. If that is all you looked at, you would be forgiven for thinking first-time buyers have been frozen out.
But the headline price and average salary are not the real story. What matters is the mortgage's monthly cost as a percentage of take-home pay. That is the accurate measure of affordability.
And this is where everything changes.
In 2007, a Wolverhampton first-time buyer household spent 41.8% of its take-home pay on mortgage payments. Today, that figure is 31.6%. That is a 24.3% proportionally lighter burden on today’s first-time buyers' household budgets compared to those of first-time buyers in 2007.
Yet it gets even more interesting when we go back to the late 1980s.
In 1989, a Wolverhampton first-time buyer household spent 48.0% of its take-home pay on a mortgage, meaning mortgage payments take 34.1% less of today’s first-time buyer household budget than in 1989.
This shows that Wolverhampton's first-time buyer affordability is not a recent thing; it is a long-term moving trend.
People then ask why this has happened. The answer lies in a combination of rising real household incomes, (UK wages are 139% higher than 1997 but a lot of that is inflation. Yet even when we strip out inflation, wages are still 23% higher in real terms), lower interest rates than the painful levels seen in the late eighties, and the structure of modern mortgage products (repayment mortgages of 30/35 years as opposed to endowment mortgages of 25 years). Also, for context, interest rates in 1989 were 14.88%. Even an average home buyer had very little room to breathe when such a large part of their income was swallowed by interest alone.
Of course, Wolverhampton itself has changed. Improved transport links and local investment have attracted more young professionals and families. Developers have brought forward new homes. The mortgage market has also expanded, with longer-term products and competitive rates. All of this feeds into affordability.
There is another factor that rarely gets the attention it deserves. Rents are rising at a pace that makes home buying look increasingly attractive. A fixed-rate mortgage gives you stability. Your payment is your payment. Renting does not offer that. Every year, you can be hit with increases that provide no long-term benefit. Many people find that their mortgage payment is not dramatically higher than their rent, and in some cases, it is lower.
This brings us to the biggest hurdle for most first-time buyers - the deposit.
The newspapers love to talk about the average first-time buyer deposit. In 2025, according to UK Finance Key Mortgage Market data, the average was £49,511 for the West Midlands. It is an eye-watering figure that scares people into believing they must find that amount.
But this average is misleading. It reflects the choices of buyers who want lower interest rates or who have family support. It is not the minimum needed.
The minimum deposit is 5%. A 95% mortgage is perfectly normal, and has been for more than sixteen years. If you have a solid credit history and stable income, lenders will look at you favourably. Some lenders even offer 100% mortgages, though these require strong credit ratings and are not for everyone. Still, the point stands. The idea that you must save £50,000 or more is not accurate for most buyers.
At the time of writing, the best 95% 5-year fixed rate deal is 4.7%. A 75% mortgage sits at 3.8%. Yes, the bigger the deposit, the better the rate, but the absence of a huge deposit does not put Wolverhampton homeownership beyond reach. You can also reduce your monthly payment by choosing a longer term, something many Wolverhampton first-time buyers may wish to do.
Homeownership also creates something that renting never will. Equity. Every payment is a step towards owning an asset. Rent gives you shelter but nothing else. When you retire, owning your Wolverhampton home puts you in a far stronger position. Relying entirely on rental support from the local authority, with their limits on what support can be offered, often means downsizing, whether you want to or not.
The truth is simple. Raising a deposit is tough. No one denies that. It takes discipline, sacrifice and patience. Yet once you get past that hurdle, the affordability of the monthly mortgage is far better than people think. The numbers prove it.
Buying a first time home in Wolverhampton is not easy, but it is possible. And for many families, that realisation alone will be a breath of fresh air.
- Details
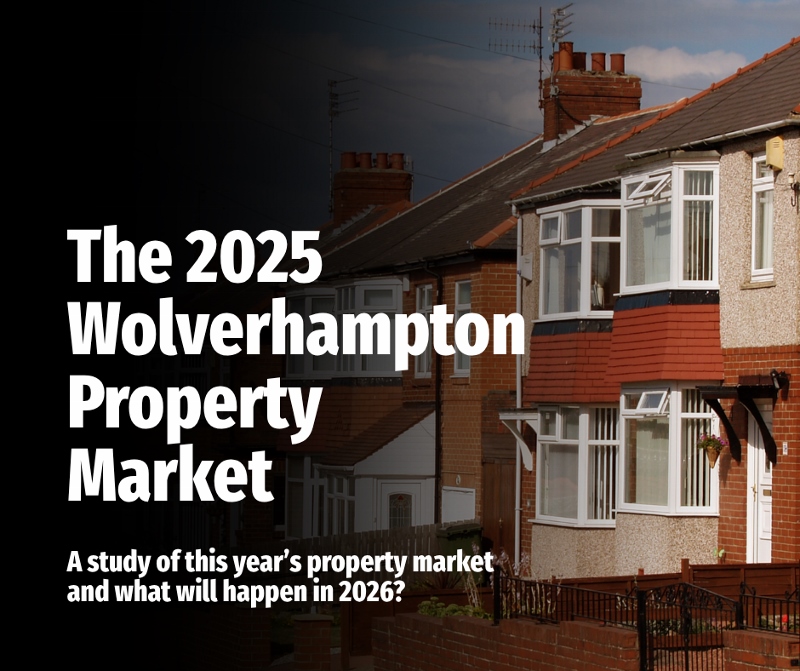
A study of this year’s property market
and what will happen in 2026?
With only a few weeks to go before the end of the year, as a Wolverhampton estate and letting agent, we wanted to share what has happened in both the UK and Wolverhampton property markets in 2025, analysing the trends for Wolverhampton homeowners, home buyers and landlords alike… and then compare them to previous years.
All statistics for each year are up to 16 November (to ensure a level playing field). Starting with the UK statistics, looking at new properties on the market (listings), sales agreed and houses sold (i.e. exchanged and completed).
The Number of Homes Coming on the Market in the UK
In 2023, 1,407,751 homes were listed for sale across the UK. That number rose to 1,521,906 in 2024 and 1,567,258 in 2025.
The average asking price of homes coming to market in 2023 was £422,722, with an average of £361 per square foot. In 2024, this increased to £430,868 and £372 per square foot. By 2025, the average asking price remained steady at £429,684, while the average price per square foot increased again to £383.
This rise in £/sq.ft wasn’t driven by broad price growth, but by a shift in the type of homes being listed. More smaller, lower-priced homes (which usually achieve a higher £/sq.ft) and more high-end properties (which also tend to sit higher on that metric) came to market. With fewer mid-priced homes in the mix, this change lifted the overall £/sq.ft price, despite headline asking prices barely moving.
The Number of Homes Sold in the UK
In 2023, 824,665 homes across the UK went under offer (sold subject to contract) at an average price of £356,026, equating to £331 per square foot. By the end of that year, 689,542 of those deals reached exchange and completion, achieving an average final sale price of £357,134, or £330 per square foot.
Fast forward to 2024, and both activity and values edged up. A total of 958,239 homes sold subject to contract at an average of £360,755 (£338 per square foot), while 734,148 reached exchange and completion at £355,168 and £332 per square foot.
Then came 2025, when the market found another gear. 997,472 homes were agreed upon for sale at an average of £362,703 (£334 per square foot), and 782,776 reached exchange and completion at £361,086 and £338 per square foot.
What’s striking is that while average prices have barely shifted year to year, the £/sq.ft figures reveal the real story. It’s not that homes are getting more expensive, but that the mix of what’s selling is changing. More smaller properties and more high-end homes both push up the £/sq.ft figure, even as overall prices remain broadly level. It's a reminder that the shape of the market can change the numbers just as much as the prices themselves.
The number of transactions has risen sharply, yet the average price paid for a UK home remains the same, and the £/sq.ft figure has remained broadly stable. In other words, house prices haven't really climbed, but the volume of sales has surged. And that matters, because the most accurate indicator of the health of the UK property market isn't house prices at all, it's how many homes are selling.
Such a marked shift in both activity and market composition warrants a closer examination to understand what is driving it and what it might mean for local markets, such as Wolverhampton.
What’s Behind the UK Property Market’s Continued Stability?
Several key forces have fuelled the property market’s renewed momentum:
- Falling Mortgage Rates: As borrowing costs have eased, buyers who held off during the rate peaks of 2023 have started to return, restoring confidence and unlocking pent-up demand.
- Wage Growth: Steady, above inflation increases in earnings have strengthened affordability for many households, giving buyers greater confidence to take their next step.
- Low (but slightly rising) Unemployment: Although unemployment increased slightly in 2025, it remains close to historic lows. The job market remains strong enough to provide people with the security needed to commit to major purchases, such as a home.
- Evolving Lifestyles: Post-pandemic shifts in how and where people want to live continue to shape demand. Many buyers are still prioritising space, flexibility, and quality of life over simple location.
- Not Enough Homes Being Built: A growing and ageing population has collided with decades of under-delivery. The UK needs around 300,000 new homes every year to keep up with demand; yet, over the past 30 years, it has averaged only around 210,000 per year. That shortfall of roughly 2.7 million homes has created intense pressure on both prices and availability, leaving supply far behind where it needs to be.
Combined, these trends have helped sustain activity and sentiment in the housing market, even as wider economic conditions remain mixed.
Wolverhampton’s Property Market: A Comparative Analysis of 2023 vs 2024 vs 2025
In 2023, a total of 3,327 homes were listed for sale in Wolverhampton, with an average asking price of £256,664. That same year, 1,894 properties were successfully exchanged and completed, achieving an average sale price of £237,813.
In 2024, listings edged higher as 3,385 homes came onto the market, with the average asking price of £269,082. The number of exchange/completions also increased at 2,048 homes, with the average price achieved remaining similar at £241,185, indicating that well-priced homes continued to attract solid buyer demand.
By 2025, Wolverhampton’s market found another gear. 3,480 homes were listed for sale at an average asking price of £278,176. 2,127 homes went on to exchange and complete, up 3.8% on the previous year, at an average sale price of £258,528.
What stands out is the steady rise in the number of homes being brought to market and the growth in completed transactions, even as achieved prices have held relatively stable. Sellers have become increasingly confident about listing their homes for sale, while buyers remain active, creating a healthier and more balanced property market in Wolverhampton.
In short, Wolverhampton’s property market has seen consistent progress since 2023. More homes are being listed, more sales are getting over the line, and the gap between asking and achieved prices remains realistic. It’s a sign of a market that’s maturing rather than overheating… steady, grounded, and underpinned by genuine demand rather than speculation.
(Wolverhampton is WV1/2/3/4/6/10/11).
What About the 2026 Property Market?
Wolverhampton's property market does not operate in isolation. It is shaped by a mix of local influences that often mirror national trends yet play out differently here. Employment levels, new infrastructure projects, and demographic shifts all affect local demand and supply for homes. Regional policies also play a part, influencing everything from development opportunities to rental dynamics. For homeowners and landlords alike, understanding these local nuances is crucial for making informed, well timed decisions.
As we move into 2026, the UK property market continues to show stability, but (and it’s a big but) Wolverhampton won't follow the national picture exactly. Local variations will always matter more than national averages, and that is where real opportunity lies. Local market knowledge remains a significant advantage for Wolverhampton homeowners looking to sell or landlords managing their portfolios. Knowing where your property sits within the Wolverhampton market can help you spot opportunities and avoid pitfalls.
In the last two years, only half (53%) of the homes in the UK that came on the market actually sold, whilst in Wolverhampton, it has
been 63.72%.
That alone underlines the single most important rule in the Wolverhampton property market: price your home realistically from day one. Every house has a price window where it attracts maximum interest. Start too high, and you miss those crucial first few weeks when the most motivated buyers are active.
Additionally, among UK homes that do sell, 53% sell within 35 days and 71% within 63 days. Selling quicker also increases your chance of getting to exchange and completion (i.e. you moving home). Denton House Research, after analysing over 2 million UK home sales, found that properties that see a buyer within 25 days of the home coming on the market have a 94% chance of reaching completion. Yet if the sale is agreed after 100 days of the home coming on the market, the chance of it completing falls to 56%.
Further evidence from Hamptons supports this. Analysing millions of home sales since 2001, they found that (excluding the Covid years) British homes typically sell within 0.9% to 1.3% of their final asking price. That’s the price before going under offer, not the original asking price if it was later reduced. This highlights the importance of setting the right price from the outset.
As an experienced local estate agent in Wolverhampton, I understand the patterns behind these numbers. My goal is to help you set a realistic asking price that maximises your sale potential while achieving a strong market value. I study Wolverhampton’s housing data daily, tracking what sells, what doesn’t, and why, so your home is priced to sell, not to sit. If you are planning to move in 2026 and want a professional, data led approach that works with the realities of today’s Wolverhampton market, get in touch. Together, we will position your property to attract the right buyers quickly and secure a smooth, successful sale.
- Details
Some homes in Wolverhampton fly off the market within weeks. Others sit for months, attract only a handful of viewings, then quietly disappear from the portals, unsold.
The difference isn’t luck, it’s sellability.
Would it surprise you that of the 10.94 million homes that have left UK estate agents books since January 2019, only 6.33 million (or 57.86%) sold and moved. The other 4.61 million came off the market unsold. This is the extent of the sellability issue.
Looking more locally, the past two years of data reveal a clear pattern in Wolverhampton’s market. Some types of homes are far more likely to sell than others. Let’s look at what the numbers show and what that means for homeowners and landlords across the city.
Sellability by Wolverhampton Property Type
Let’s start with property type (comparing it to the national figures):
In the past two years, 67.25% of houses in Wolverhampton that left all estate agents books in the city sold and completed (i.e. the home owner moved), compared with 61.04% nationally.
64.86% of Wolverhampton flats and apartments sold, while nationally it was 45.98%.
Whilst 62.14% of bungalows sold in Wolverhampton, compared with 57.35% nationally.
Sellability by Wolverhampton House Price Range
Price, of course, changes everything. So, looking at the last two years:
At the lower end, Wolverhampton homes priced up to £250,000 sold 71.24% of the time, compared to the 63.16% national figure.
Between £250,000 and £500,000, 60.88% of Wolverhampton homes sold (and completed) versus 54.25% nationally.
53.48% of £500,000 to £750,000 priced Wolverhampton homes found buyers and sold, compared with 45.77% nationally.
£750,000 to £1 million, the sellability of Wolverhampton homes drops to 51.4%, while nationally it’s 42.47%.
And finally, in the £1 million-plus bracket, just 38.46% of listings in Wolverhampton resulted in a completed sale, compared with 34.78% across the UK.
It shows that the higher the price, the lower the sellability rate because the number of buyers able or willing to pay top end prices in Wolverhampton is limited.
Why Some Wolverhampton Homes Sell and Others Don’t
The numbers tell us what happened, but not why. The reasons usually fall into three camps.
- Price positioning.
Every home has a price window where it attracts maximum interest. Start too high and you miss the crucial first few weeks when buyers are most active.
Denton House Research found after analysing over 2 million house sales, that properties finding a buyer within 25 days have a 94% chance of the sale completing (i.e. you moving). After 100 days, even if the home does sell (which is slim), the chance of your sale getting to completion (and you moving home) drops to 56%.
Roughly half of all homes that come to market ever find a buyer. But for the ones that do, speed matters. 41.8% sell within the first 28 days, 70.9% within 63 days, and by 100 days, 77.7% have agreed a sale.
Starting with a realistic price is further backed up with data from Hamptons that shows of the millions of homes that have sold since 2001, aside from the Covid year, British homes have typically sold within about 0.9% to 1.3% of their ‘final’ asking price (final as in the headline asking price before it went sale agreed – not the original asking price if it was reduced in price after it came on the market). This again shows how vital it is to price realistically from the start.
- Marketing quality.
Buyers buy with their eyes. Listings with poor photography and weak descriptions get scrolled past. Presentation can be the difference between a viewing and a swipe. - Agent skill and communication.
The best Wolverhampton estate agents keep momentum. They update, negotiate, and manage buyers and solicitors through the sticky middle of a transaction. Others simply upload to portals and wait. The difference shows up in these sellability figures.
What It Means for Wolverhampton Homeowners Planning 2026 Moves
The Wolverhampton market is not broken, but it is selective. The data shows that most homes priced sensibly will sell. It’s the ones that start too high or stand still that struggle.
In estate agency, sellability isn’t luck. It’s about strategy, the right price, the right preparation, and the right partner guiding the process.
If you’re thinking of moving in 2026 and want an evidence-based view of how sellable your Wolverhampton home really is, ask for the facts before you list. The numbers rarely lie, and knowing them could be the difference between a For Sale board and a Sold sign.