
-
Home

- Blog
Blog
- Details
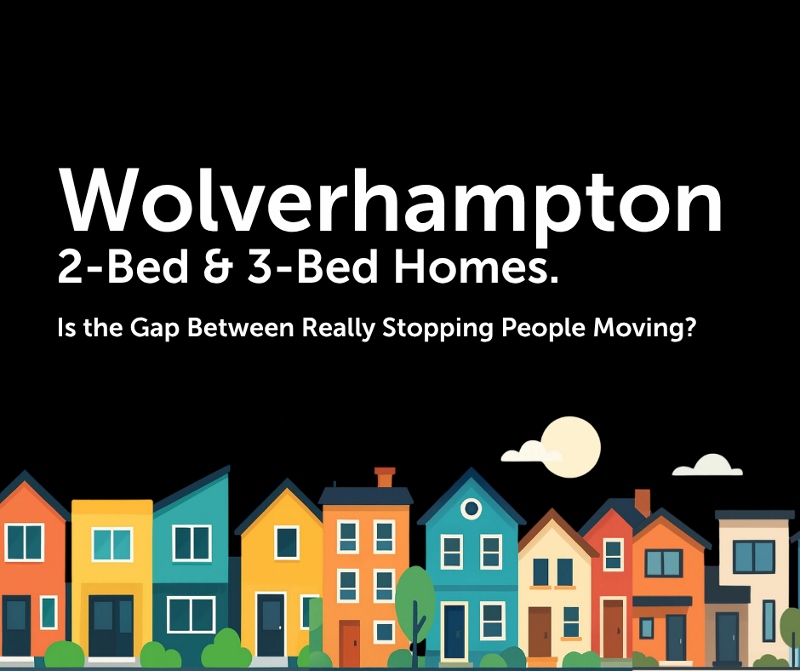
Over the last few weeks, there has been a growing narrative in the national press suggesting that the housing ladder is becoming increasingly difficult to climb. Much of this centres around the widening gap between smaller and larger homes, with many commentators suggesting that homeowners are becoming “stuck” and unable to move up.
There is some truth in that argument.
However, when you look at the Wolverhampton property market in detail, the picture is not quite as straightforward.
The Changing Price Gap in Wolverhampton
If we compare the average asking prices of 2-bedroom and 3-bedroom homes in Wolverhampton between 2006 and 2026, the shift is clear.
In 2006, the average asking price of a 2-bedroom home in Wolverhampton was £122,370 … whilst a typical 3-bedroom home sat at £149,700 creating a gap of £27,330 (which represented a difference of 22%).
Fast forward to 2026, and those figures have moved to £180,370 for a 2-bedroom home and £267,740 for a 3-bedroom home. The gap is now £87,370 equating to a difference of 48%.
On the face of it, that is a significant widening. It would be easy to conclude that this alone is making it harder for Wolverhampton homeowners to move up the ladder. Yet that conclusion only tells part of the story.
Why the Headline Gap Does Not Tell the Whole Story
Property is often discussed in terms of price, but in reality, most buyers make decisions based on affordability, and affordability is driven far more by monthly mortgage payments than by headline values.
Back in 2006, 95% first-time buyer mortgage rates were typically between 5.5% and 6%, and in many cases higher. Borrowing was more expensive, and monthly repayments reflected that.
Today, whilst mortgage rates have moved around in recent years, they remain below those mid-2000s levels for many borrowers. At the time of writing, the best 95% first-time buyer mortgage on the market is 4.74%.
This means that although the price gap between 2-bedroom and 3-bedroom homes has increased, the cost of bridging that gap has not risen at the same rate.
Now, let us show that using Wolverhampton figures.
Looking at a typical 95% loan-to-value mortgage at 5.8% (on a 25-year term), the monthly cost of a 2-bedroom home in Wolverhampton in 2006 was £735 per month. For a 3-bedroom home, it was approximately £899 per month.
That’s a difference of roughly £164 per month between a 2-bed to a 3-bed Wolverhampton home.
Fast forward to today.
Looking at a 95% loan-to-value mortgage at 4.74% (on a 25-year term), the monthly cost of a 2-bedroom home in Wolverhampton sits at around £976 per month, whilst a 3-bedroom home is £1,449 per month.
That creates a gap of around £473 per month.
On the surface, that looks like a significant jump. However, this is where context matters.
This article is about making the step up the ladder from a 2-bed to a 3-bed Wolverhampton home.
Most homeowners moving from a 2-bedroom to a 3-bedroom home are not doing so at 95% loan-to-value. By the time they make that move, they have typically owned their property for five or six years. During that time, they have built up equity through repayments and, in many cases, house price growth.
That means their next purchase would be funded at a lower loan-to-value of around 75% (because they would have built up that equity as mentioned in the previous paragraph). So when you look at the numbers on that basis, the picture changes again. The best 75% loan-to-value mortgage today is 4.04%, making the monthly mortgage cost of a typical 3-bedroom Wolverhampton home (even with the higher price) £1,064 per month.
In other words, whilst the price gap between Wolverhampton 2-bed and 3-bed homes has widened, the real cost of stepping up the ladder for existing homeowners, when viewed through the lens of how people actually move (i.e. mortgage payments), has increased, yet the growth of that increase has been lessened because of the increase in equity, lower LTV and lower mortgage rates.
The Role of Wages and Household Income
Another factor that is often overlooked in this discussion is income.
Over the past two decades, real household earnings have increased by 5.8% (that’s after inflation). Not uniformly, and not without periods of pressure, but the overall direction has been upward.
Alongside this, dual-income households have become more common, and lenders now assess affordability with a broader view of income and expenditure than they did in the past. When this is considered alongside mortgage costs, it becomes clear that today’s buyers are operating in a very different financial environment to those in 2006.
So Why Does It Feel Harder to Move in Wolverhampton?
If the financial picture is more balanced than the headlines suggest, why does it feel more difficult for homeowners to move up the ladder?
The answer lies partly in perception.
Many Wolverhampton homeowners understandably focus on the price difference between homes. Seeing a larger gap can be off-putting, particularly when combined with wider economic uncertainty and cautious media coverage.
At the same time, certain parts of the market, particularly flats, have seen slower price growth than houses. This can make it harder for some homeowners to build the level of equity they had expected.
As a result, a number of potential movers pause and delay their plans, or decide not to explore their options at all.
What This Means for the Wolverhampton Market
In every property market, there will always be households for whom moving is not currently viable.
However, there is also a significant group of homeowners who assume that moving is out of reach, when in reality it may still be achievable.
This group is important.
Because when fewer people take the step to explore a move, the market can appear quieter than it actually needs to be.
Wolverhampton – A Property Market That Is Cautious, Not Broken
The Wolverhampton housing market is not broken.
It is, at present, more cautious. The difference matters. A cautious market is one where decisions take longer, confidence is more measured, and buyers and sellers seek greater certainty. It is not a market without movement.
- Details
We often discuss the Wolverhampton property market through house prices.
Yet long before price comes a home’s character. And long before its character comes its age.
Every town or city has its own housing fingerprint. Not just streets and postcodes, but a layered history of building booms, social change, and shifting design. Wolverhampton is no different.
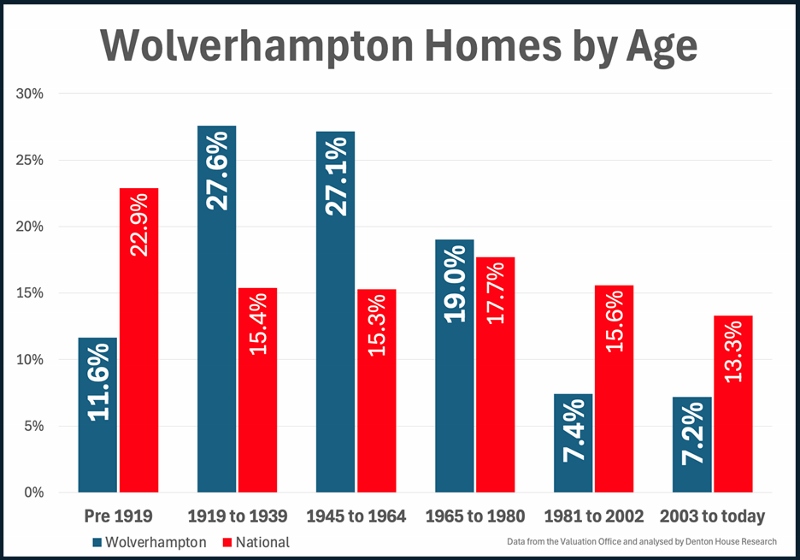
Wolverhampton has 108,231 homes, according to the Valuation Office. Breaking them down by period built reveals a pattern that becomes even more interesting when compared to the national picture.
Pre-1919
In Wolverhampton, 12,603 homes were built before 1919. That represents 11.6% of the housing stock.
Nationally, 22.9% of homes fall into this pre-1919 bracket.
In the towns and cities, these are the Victorian and Edwardian properties. Terraces sit near town centres. Streets were shaped by industrial expansion and agricultural heritage. They tend to form the historic heart of an area. The Georgian homes bring high ceilings and large windows, whilst the Victorian red brick terraced homes with their solid walls and slate roofs, often need ongoing maintenance.
1919 to 1939
Wolverhampton has 29,859 interwar homes, accounting for 27.6% of its housing.
Across the UK, 15.4% of homes were built during those same years.
The interwar period was defined by suburban growth. Semi-detached homes with circular bay windows and large gardens built on tree-lined avenues were the popular choice. A shift towards owner occupation and planned estates. In some areas, this era accounts for a substantial share of the housing stock. In others, it plays a more modest role.
These homes still sit in established neighbourhoods reflecting their era.
1945 to 1964
In Wolverhampton, 29,377 homes were built in the immediate post-war years. That is 27.1% of the total.
Nationally, 15.3% of homes were built between 1945 and 1964.
Britain faced a severe housing crisis with over a million homes destroyed and many more damaged. This led to a period of intense, government controlled "rationing" of housing until 1954, during which materials were limited and new builds were restricted to public, low-density, or temporary structures. It was only from 1954 that private builders began building en masse, after rationing ended. The semi-detached home was still the home of choice, often with generous plots yet a more straightforward ‘plainer’ design (when compared to pre-war semis). Over the decades, many have been extended, remodelled and modernised.
Comparing local and national proportions highlights the distinct ways each area experienced post-war expansion, emphasising the contrasts between their growth patterns.
1965 to 1980
20,576 Wolverhampton homes were built in the late 1960s and 1970s, comprising 19.0% of the housing stock.
Across the UK, 17.7% of homes date from this period.
The late sixties and seventies reshaped many communities. Estate building accelerated. Layouts evolved. Garages became standard. Cul-de-sacs and suburban sprawl became familiar features. In some local authorities around the UK, this era forms the backbone of modern housing supply. In others, it plays a smaller part.
1981 to 2002
Between 1981-2002, 8,040 homes were built in our local authority ... 7.4% of the housing stock.
Nationally, the figure stands at 15.6%.
These homes are seen as established but still modern by many buyers. Double glazing and cavity wall insulation became standard. Building standards improved. Layouts began to match modern living. These homes balance space and efficiency.
2003 to Today
Since 2003, Wolverhampton has added 7,776 homes. That is 7.2% of its housing stock.
Nationally, 13.3% of homes fall into this post millennium bracket.
These are the most recent developments. Built under tighter regulations. Designed with improved energy efficiency in mind. Often shaped by modern buyer expectations around kitchens, bathrooms and open plan living, yet at the expense of larger gardens.
Why Ageing Property Matters
Understanding the age profile of an area helps explain more than you might think.
Age shapes maintenance needs. It influences energy performance. It affects layout, garden size, and parking. It also shapes how buyers see certain streets or estates.
Most importantly, it gives context.
Wolverhampton is not defined by just one building era. It is defined by many. When you compare each age band with the national average, you see how unique the local housing really is.
If you ever wonder where your Wolverhampton home fits in this story, or how the housing mix shapes today’s market, we are happy to discuss it with you.
After all, property is not just about price.
It is about place, history and the layers that built it.
- Details
When most homeowners decide to put their Wolverhampton home on the market, they assume one thing.
The chances their home will sell are very good.
After all, why wouldn’t it? You ask an estate agent to place your home on the market, the board goes up, pictures of your home appear on the portals and viewings subsequently get booked and offers made.
Except it is not. Looking at every Wolverhampton estate agent…
Over the last two years, the chances of selling your
Wolverhampton home and moving have been 66.8%
The remaining 33.2% of homes failed to sell, withdrawing from the market unsold.
(Wolverhampton WV1-4/6/10/11).
And those chances vary immensely, property to property.
Whether you end up selling your home or not practically always comes down to two things.
- The marketing of your home.
- The pricing of your home.
We have spoken many times recently in previous blog posts about marketing, so for this article we wish to focus on pricing strategy. Every Wolverhampton home is unique. Its layout, type, condition, price band, location, presentation and even timing all go together to make a difference. Let us share with you what we found about the Wolverhampton property market and the chances of getting your home sold (and moved), split down by price band and type.
So, we have looked at the data for every Wolverhampton property that has left every Wolverhampton estate agent’s book over the last two years. Then calculated how many have successfully sold (and exchanged and completed) versus how many were withdrawn and never sold.
The results are eye opening.
The Wolverhampton Selling Odds by Price Bracket
- Up to £250k: 3,039 Wolverhampton homes sold & moved, 1,224 unsold & withdrawn. 71.3% success rate.
- £250k to £500k: 1,761 Wolverhampton homes sold & moved, 1,029 unsold & withdrawn. 63.1% success rate.
- £500k to £1m: 239 Wolverhampton homes sold & moved, 220 unsold & withdrawn. 52.1% success rate.
- £1m+: 17 Wolverhampton homes sold & moved, 28 unsold & withdrawn. 37.8% success rate.
So, as asking prices increase, the odds of selling your home fall.
The Wolverhampton Selling Odds by Type
- Bungalows: 63.1% success rate.
- Houses: 68.1% success rate.
- Apartments/flats: 64.3% success rate.
- Others (character property/building plots/mobile homes/retirement homes): 36.7% success rate.
Why Do Higher-Priced Wolverhampton Homes Find It Harder to Sell?
As property values rise, the number of potential buyers naturally reduces. The market becomes thinner at the top end. There are fewer proceedable purchasers, affordability pressures intensify and mortgage lending criteria become more demanding. Even financially comfortable buyers tend to exercise greater caution when borrowing costs are elevated.
Beyond simple affordability, higher value homes are often more complex to price accurately. Comparable evidence is usually more limited, and properties differ more widely in specification, layout and location. This makes precise positioning more difficult and increases the risk of misjudging the market.
There is also a behavioural factor. Some agents understandably value the visibility that prestige homes bring to their portfolio. However, the desire to secure an impressive instruction can sometimes lead to optimistic pricing. At higher price points, even a relatively small degree of overvaluation can significantly reduce early interest. In many cases, overpricing becomes the most significant obstacle to securing a sale.
The Risks Attached to Overpricing
During the unusually buoyant conditions of 2021, many sellers were able to achieve ambitious asking prices. Demand outstripped supply, borrowing was inexpensive and buyers were competing strongly.
Those conditions no longer apply.
In today’s Wolverhampton market, pricing above the level buyers perceive as fair is one of the most reliable ways to see a property withdraw unsold. Once initial momentum is lost, subsequent reductions often struggle to recreate urgency. Buyers may question why the home has not already sold, and confidence can quietly diminish. The data suggests that this pattern is particularly evident in certain higher price brackets.
The Role of the Estate Agent
A common misconception among Wolverhampton sellers is that asking price equates to value. In reality the value is defined not by what you, your neighbour or best friend thinks it’s worth, but only by what a committed ready, willing and able buyer is prepared to pay.
Attracting that buyer requires more than online portal exposure. In current market conditions, three factors are especially important.
First, setting a price that aligns with comparable evidence and buyer expectations from the outset. Second, carefully qualifying prospective purchasers to ensure they are financially and procedurally ready. Third, managing negotiations firmly and guiding the transaction all the way through to exchange and completion.
Experienced Wolverhampton agents recognise that buyer psychology plays a central role. They balance optimism with realism, maintain communication throughout the process and aim to create competitive tension where possible rather than relying solely on passive interest.
Interpreting the Saleability Statistics on the Wolverhampton Market
Every Wolverhampton property is individual. Location, presentation, condition and timing all influence outcomes. The figures discussed reflect broad trends rather than predictions for any specific home.
Some Wolverhampton properties will outperform the averages. Others may struggle despite strong presentation. The critical point is not simply to be aware of the statistics, but to understand how they relate to your own circumstances and price bracket.
A More Useful Question for Wolverhampton Sellers
Instead of asking, “What price would I like to achieve?”, Wolverhampton homeowners might consider a more practical question: “What pricing strategy gives me the strongest chance of completing my move?”
Very few people put their home on the market with the intention of testing it indefinitely. The objective is to exchange contracts, complete and get you moved on to the next stage.
Pricing remains the single most significant variable within a seller’s control. The decision made at launch can either build momentum or quietly restrict it.
It is also important to remember that the financial outcome of moving is determined not solely by the sale price achieved, but by the relationship between that figure and the cost of the onward purchase. The true cost of moving lies in the gap between the two transactions, not in the headline price alone.
That broader perspective is often overlooked when decisions are made at the outset of a sale.
- Details
In this detailed market update, we explore:
• Current average house prices in Walsall
• How the market has performed over the past 12 months
• Property values by type
• The local rental landscape
• What buyers and sellers should expect in 2026
All figures referenced are based on the latest available data from the UK House Price Index (HM Land Registry/ONS) and the ONS Private Rental Index.
Walsall House Prices in 2026: Where Are We Now?
According to the most recent UK House Price Index data, the average property price in Walsall stood at approximately £215,000–£220,000 at the close of 2025, reflecting annual growth in the region of 4–5% year-on-year.
This follows a period of adjustment during 2023, when higher mortgage rates cooled activity across the UK. Throughout 2024 and into 2025, however, we saw improved stability as borrowing conditions became more predictable and buyer confidence gradually returned.
How Does Walsall Compare?
• The average house price across England remains significantly higher (well above £290,000).
• Walsall therefore continues to offer strong relative affordability within the West Midlands.
• Local growth has been steady rather than volatile — a positive indicator of sustainable demand rather than short-term speculation.
For homeowners, this means equity has continued to build at a sensible pace. For buyers, Walsall remains one of the more accessible areas within reach of Birmingham and the wider Black Country.
Property Prices by Type in Walsall
Breaking the data down by property type provides useful context:
• Detached homes: Typically averaging in the region of £340,000–£360,000
• Semi-detached properties: Commonly around £210,000–£230,000
• Terraced houses: Frequently between £170,000–£190,000
• Flats and apartments: Often in the £110,000–£140,000 range
(These figures reflect UK House Price Index averages and market sales data across the past 12 months.)
What This Tells Us
Three-bedroom semi-detached homes continue to represent one of the strongest-performing segments of the local market, driven by family demand. Entry-level terraces and apartments remain attractive to first-time buyers, while detached properties command a premium in established residential areas.
Overall, demand remains consistent across core property types, with pricing sensitivity more noticeable in the higher-value brackets.
⸻
Time on Market & Buyer Behaviour
Over the past year, the average time to secure a buyer locally has generally ranged between 10 and 14 weeks, depending on pricing strategy, presentation and location.
We are seeing:
• Well-priced homes generating strong early interest
• Over-ambitious listings requiring later price adjustments
• Buyers taking slightly longer to commit compared to the highly competitive 2021 market
In short, Walsall is operating in a “normalised” market — neither overheated nor subdued.
For sellers, correct pricing at launch is now more important than ever.
The Walsall Rental Market in 2026
The private rental sector in Walsall has shown continued growth.
ONS data indicates that average private rents locally are now around £875–£900 per calendar month, reflecting annual growth of approximately 6%.
What’s Driving Rental Growth?
• Continued tenant demand
• Limited supply of quality rental homes
• Landlords factoring in higher finance and compliance costs
For investors, this has supported gross rental yields that often sit between 5% and 7%, depending on purchase price and location.
For tenants, affordability remains an important consideration, particularly in the context of wider cost-of-living pressures.
What’s Influencing the Walsall Property Market?
Several key factors continue to shape local conditions:
1. Mortgage Rate Stability
Following volatility during 2022–23, mortgage rates have stabilised considerably. While they are no longer at historic lows, the predictability of borrowing costs has helped restore confidence among buyers.
2. Relative Affordability
Compared with Birmingham and many southern regions, Walsall offers:
• Lower entry prices
• Strong value per square foot
• Competitive yields for landlords
Affordability continues to underpin steady demand.
3. Local Appeal & Connectivity
Walsall’s transport links, access to major motorway networks, schooling options and ongoing regeneration projects all support continued housing need.
Markets built on practical demand — rather than speculation — tend to demonstrate greater long-term resilience.
Is 2026 a Good Time to Buy in Walsall?
For buyers who are financially prepared, 2026 presents a period of relative stability:
• Price growth remains modest rather than sharp
• Mortgage products are more predictable
• Stock levels are healthier than during the supply shortages of 2021–22
This gives buyers room to negotiate while still recognising that quality homes attract competition.
Is It a Good Time to Sell?
For sellers, success depends heavily on strategy.
Homes that are:
• Accurately valued
• Well presented
• Professionally marketed
…are continuing to achieve solid outcomes.
Overpricing, however, can lead to extended marketing periods and eventual reductions. In today’s environment, realism delivers results.
⸻
Investment Outlook for Landlords
Walsall remains attractive to property investors because of:
• Competitive purchase prices
• Consistent tenant demand
• Healthy rental yields
However, landlords must remain mindful of:
• Ongoing regulatory changes
• EPC requirements
• Tenant rights reforms
Professional lettings management is increasingly important in protecting compliance and long-term returns.
Outlook for the Remainder of 2026
Most national forecasts point towards:
• Modest single-digit house price growth
• Continued, though potentially moderating, rental inflation
• A broadly balanced market between buyers and sellers
For Walsall specifically, the outlook appears steady rather than dramatic. There are no strong indicators of significant decline, but equally, rapid price surges are unlikely. The fundamentals — affordability, demand and regional connectivity — remain supportive.
Why Local Expertise Matters
Property markets are highly localised. Two streets within the same postcode can perform very differently depending on presentation, pricing strategy and buyer demand.
National headlines rarely reflect what is happening on the ground in Walsall. That is why tailored advice based on live market activity and transactional evidence is so important.
Thinking of Moving in Walsall?
Whether you are:
• A first-time buyer
• A growing family needing more space
• A landlord reviewing your portfolio
• Or a homeowner considering selling
Understanding current market conditions gives you confidence and clarity.
At Skitts, we combine up-to-date data with genuine local insight across Walsall and surrounding areas. If you would like a confidential, no-obligation market appraisal or simply a conversation about your options, our team would be delighted to help.
Final Thoughts
The Walsall property market in 2026 is defined by balance.
It is growing — but sustainably.
Active — but not overheated.
Affordable — yet increasingly competitive in key segments.
For those making informed decisions, it remains a market full of opportunity.
- Details
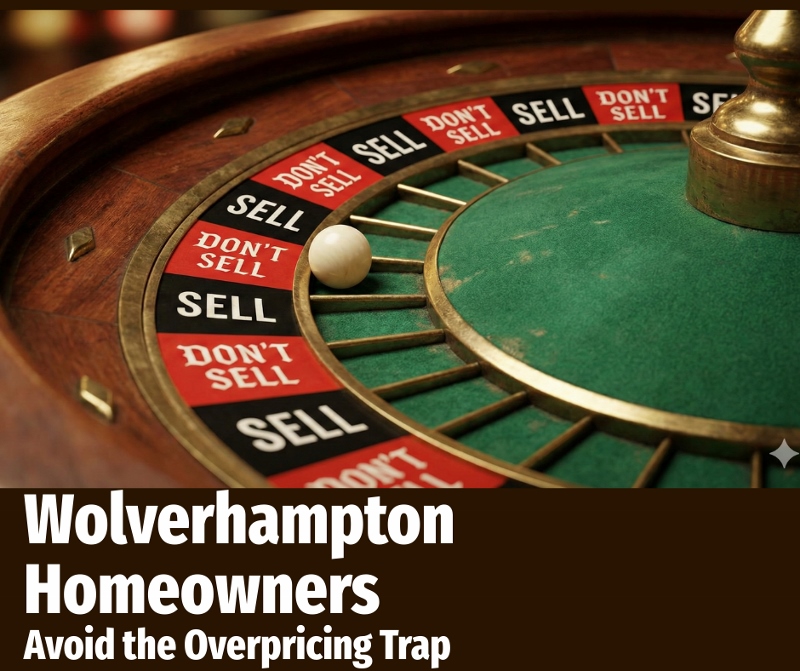
The property market is frequently misunderstood, especially amid dramatic news stories. Here’s what Wolverhampton homeowners need to know to avoid costly traps.
To understand the property market, it is important to consider the broader context.
Nationally, house price growth is treading water at 2.5% a year, and there were 663k UK homes available for sale in the month of January, compared to the three-year pre-COVID average level of 559k. That said, homes are still selling. In fact, 6.8% more West Midlands properties were sold in January 2026 compared to January 2024.
Looking at Wolverhampton, 230 homes sold stc in January 2024, whilst in January 2026 that had risen to 242, a 5.22% increase.
In January 2024, Wolverhampton had 1,332 homes for sale: by January 2026, 1,373.
And that is precisely why pricing strategy matters now more than ever if you want to sell.
Why Pricing Right in Wolverhampton is Important
Launching your Wolverhampton home at an overly ambitious price will damage your chances of selling and the price you achieve.
Buyers search within set budgets. If your property sits above comparable homes, it is filtered out before it is even seen. Even when it does attract attention, an inflated price can suggest you are testing the market rather than being serious about selling.
The result is often a slow start, followed by price reductions. The longer a home sits unsold, the more buyers begin to wonder what is wrong with it. That doubt can linger, even if the only issue was the initial price.
A realistic, market-aligned asking price attracts more interest, builds momentum, and increases the likelihood of a successful sale and completion. Here are four key statistics that illustrate these points:
- Nationally, in 2025, only 55.4% of homes were sold and moved (the other 44.6% remained unsold). In simple terms, you only had just over a one in two chance of moving if you put your home up for sale last year.
- Another fact is that if a property has not secured a buyer by week twelve, its chance of selling is just 14.5%.
- Next stat, when a home agrees a sale within the first 25 days (typically because it is priced realistically), it has a 94% chance of reaching exchange and completion (i.e., you move). Leave it until day 100, and should you agree a sale on your home (which will be low anyway), that success rate to get you from sale agreed to exchange and completion drops to 56%. Speed is not luck. It is usually pricing.
- Finally, for homes that receive a buyer and reach a sale agreement, those with no price reductions are 135% more likely to complete the sale than those with reductions. Additionally, they typically sell in about a third of the time and have only half the risk of falling through compared to reduced-price properties. Pricing correctly at launch preserves your equity and significantly increases your odds of successfully moving.
Focus on Wolverhampton
Let us look at the extent of the problem in Wolverhampton.
In 2025, 3,793 Wolverhampton homes left the books of all the estate agents in Wolverhampton.
When a property leaves the books of an estate agent, only one of two things can happen. Either the property is sold (i.e., it exchanges and completes), meaning the homeowner moves, or, secondly, the property is withdrawn from the market unsold, leaving the homeowner stuck.
Of those 3,793 Wolverhampton homes, 2,575 moved home (i.e., exchanged and completed).
And 1,218 withdrew unsold.
So, in 2025, only 67.89% of Wolverhampton homes listed for sale resulted in successful moves for their owners. The remaining 32.11% were withdrawn unsold.
(Wolverhampton = WV1/2/3/4/6/10/11).
Some might say, well of course, the property could leave that estate agent’s books and go to another agent in the city. Will it surprise you that only 6.9% of all UK home sales sell with the second estate agent? It takes a particular set of skills to sell a property that has been on the market before. (Feel free to contact us to find out what is needed the second time round).
Independent research from Which backs this up, showing that homes priced sensibly from day one sell faster and, in many cases, achieve a stronger final outcome than those launched 5% to 10%+ too high and then reduced. Buyers are well informed. If a property looks overpriced compared to similar Wolverhampton homes, they simply move on.
The Costly Trap of Overvaluing. What it Means for Your Wolverhampton Move
If you want to sell in Wolverhampton, the smartest place to start is with a realistic asking price.
Overvaluing/over pricing might feel reassuring at first. It can sound ambitious. It can even feel flattering. But once your home hits the market, you only get one true launch window. Those first few weeks are when buyer attention is at its strongest. Miss that moment with an inflated price, and momentum quickly fades. What should have been excitement becomes hesitation.
Across Wolverhampton, more homes are coming to market priced above what buyers see as value.
Too often, this is driven by certain estate agency chains that are chasing instructions rather than completions. The result is predictable. A property sits. Interest cools. The price is reduced. Valuable time is lost. As we have already discussed, the longer it takes to secure a buyer, the lower the likelihood that the sale will reach exchange and completion. For many homeowners, that delay means losing the ‘forever home’ they had hoped for.
Compounding the issue, those same estate agency models that focus heavily on winning instructions also tie homeowners into long sole agency agreements. That length of contract often gives the agent time to talk the seller down from an inflated launch price rather than getting the pricing right at the outset. The problem, as explained earlier, is that the longer a property sits on the market, the lower the probability of it selling and, if it does secure a buyer, the lower the likelihood of that sale reaching exchange and completion.
On top of that, to add salt to the wound, some estate agency structures reward their staff for listings secured rather than sales completed. In a stabilising market like Wolverhampton’s, that approach is risky because it incentivises listing your home rather than selling it.
Correct pricing is not about being conservative. It is about being competitive.
Outlook for the Wolverhampton Property Market
We are unlikely to see dramatic house price spikes in the immediate future, but nor is there evidence of a major correction ahead. The national picture is more stable than many headlines suggest.
Longer-term drivers remain supportive. Demographic shifts, flexible working as well as a resilient labour market all underpin housing demand. UK interest rates are widely expected to sustain a gradual downward trend throughout 2026, with most forecasts placing the Bank of England base rate in the range of 3% to 3.5% by the end of 2026, assuming inflationary forces remain manageable. This would gradually improve affordability and buyer confidence. At the same time, wage growth has been running above inflation over the past year, quietly strengthening household balance sheets.
The market is definitely not without its pressures. Affordability remains sensitive to mortgage pricing, and broader economic policy will continue to play a role. Yet the fundamentals suggest a more balanced environment rather than a distressed one.
For Wolverhampton homeowners, the message is simple. In a market with more choice and greater buyer scrutiny, pricing realistically from the outset puts you in control. It protects your position, strengthens your negotiating power and gives you the best chance of moving on your terms.
If you are considering a move in Wolverhampton, a clear, data-led market appraisal can help you understand where your property truly sits in today’s market and how to place it for a successful sale. Feel free to contact us for a no-obligation talk about anything in this or our other articles on the Wolverhampton property market.