-
Home

- Blog
Blog
- Details
Many Wolverhampton rental problems do not start with bad landlords or difficult tenants.
In Wolverhampton, as in many cities across the country, they usually start with good intentions and silence. Silence about rent reviews. Silence about maintenance. Silence about what happens when life changes.
Let me give you a scenario we see more often than people realise.
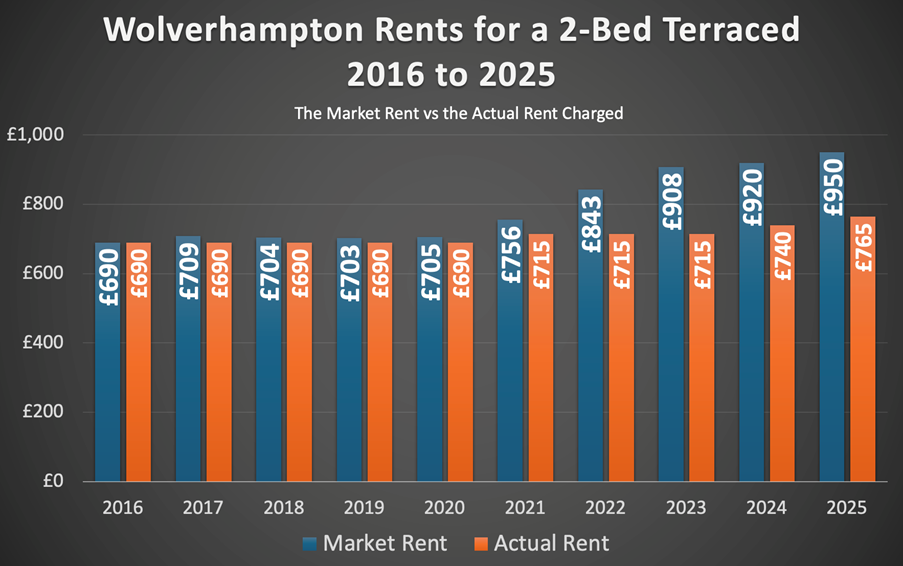
It’s a story of a tenant who moved into a two-bedroom terraced house in Wolverhampton in 2016. At the time, the rent was a very fair £690 per calendar month. It reflected the market, the condition of the home, and the local demand. Both landlord and tenant felt comfortable with the arrangement and the relationship was positive from day one.
By 2020, the monthly rent was still at £690, yet the market rate had risen to £705 (not much of a gap). Two years later (2022), the landlord had increased the rent to £715, yet the market rent was now at £843. In 2025, the rent was now £765, yet the market rent was £950, meaning there was a difference of £185 per month between the rent being paid and the market rent.
From the Wolverhampton landlord’s perspective, this rarely feels like a mistake at the time. The tenant pays reliably. They look after the home. There are no voids, no advertising costs, no awkward conversations. Increasing the rent feels uncomfortable, especially when the tenant has been loyal. Many landlords convince themselves they are doing the right thing by leaving things as they are.
From the tenant’s side, stability is everything. They built their household budget around that rent. Children settle into local schools. The house becomes a home rather than just a rental. They may notice the kitchen is dated or the bathroom could do with attention, but the rent feels fair for what they are getting, so they do not push too hard.
This is where the slow drift begins.
Rents in Wolverhampton since 2016 had risen by 37.7%, yet the landlord had only increased them by 10.9% ...
… and because the rent no longer reflected the market, the property often stops receiving the level of investment it should. Small maintenance jobs get postponed. Bigger improvements are quietly shelved. Neither party feels quite justified in demanding more, because the arrangement has become unspoken and informal. The low rent becomes part of the compromise.
Then something changes.
The landlord’s circumstances change. It might be retirement, a change in job, a separation, or simply the need to release capital. The decision is made to sell. On paper, the property should be worth a certain figure. Though, with a sitting tenant paying £185 per month below market rent, the property will have a suppressed yield and, because the property needs cosmetic work, will not achieve the same price as one producing full market rent.
The Wolverhampton landlord now faces options they never planned for.
One option is to push the rent up sharply on their Wolverhampton home to improve the figures to improve the value of the buy-to-let home. Another option is to remove the tenant to sell vacant. Yet most landlords hesitate, hoping the problem will resolve itself. Eventually, pressure wins and the property goes onto the market at a discounted price (with a sitting tenant) and sells for less than it should have done.
At this point, the tenant believes they are out of the woods, yet nothing could be further from the truth.
The new landlord owner doesn’t have the emotional connection with that tenant, so brings the rent up themselves to a market level. When the rental increase lands, the jump can be by many hundreds of pounds a month. For a tenant who has shaped their life around the previous rent, this can be unmanageable and shocking.
What follows is rarely smooth. Negotiations fail. Notices are served. Stress levels rise. In the worst cases, it ends with legal action and forced moves. Nobody feels good about it, yet everyone feels trapped by decisions made years earlier by the first landlord.
The uncomfortable truth for both Wolverhampton landlords and tenants is that regular, modest rent reviews are usually the kindest option over time for everyone. Gradual increases allow tenants to adapt. Fair market rents allow Wolverhampton landlords to maintain properties properly. Most importantly, they reduce the likelihood of sudden sales that trigger upheaval for everyone involved.
This is not about squeezing tenants or defending bad practice. It is about recognising that pretending the market does not exist does not protect people, it just delays the consequences. Slow, predictable change is far easier to live with than sudden shocks.
Sometimes, what looks like fairness in the moment quietly plants the seeds of a crisis years down the line.
If you are a ‘kind’ Wolverhampton landlord and manage the home yourself, and what we have said rings an alarm bell for you then, if you would like some free advice and our opinion, let’s have an informal chat. Call us on 0121 520 2255 and speak to the lettings team.
- Details
In early 2023, property forecasters predicted a significant UK housing downturn over the next two years, citing rising interest rates following Liz Truss's departure. Halifax expected an 8% drop, Savills predicted a 10% drop, and Nomura Bank forecast up to a 15% drop.
While these gloomy forecasts successfully grabbed headlines and generated clicks, the actual market data three years later tells a completely different story.
According to the Land Registry, the reality has been far more resilient. UK house prices are 3.93% higher today than they were in January 2023. Locally, the picture is also one of stability rather than collapse, with Wolverhampton house prices being 7.29% higher than in January 2023.
Yet even with those statistics, now that we are starting 2026, we are again hearing the same nervous question being asked all over again. Newspaper reports on the run-up to Christmas 2025 stated that there were months when house prices were dropping and asking … with these drops, will 2026 be the year house prices correction?
Putting the Property Market Data in Context
Before we start, let us all agree that bad news sells newspapers.
So, looking at the data, the first thing to note is that over the last three years, house prices in Wolverhampton have experienced many ups and downs in the Wolverhampton Land Registry averages.
For example, in February 2024, annual house prices in Wolverhampton were falling at 2.6% per annum, yet by March 2025, they were rising at 8.3% per annum. The latest Land Registry stats show we are 6.9% higher than a year ago locally.
The point here is not to look at one month in isolation, but to examine the broader trend over the medium term, because statistics without context can be misleading.
The Leading Indicator That Predicts Growth
For a deeper look at what is actually happening, we can turn to Denton House Research. They uniquely track the £/sq.ft figures at the "sale agreed" date in the UK. This is a vital metric because the £/sq.ft figures track the Land Registry data five months in advance with a 98% correlation. We have done the calculation using the £/sq ft over the last 3 years. If you recall, we stated above that UK house prices had risen by 3.93% over the last 3 years; the £/sq.ft figures showed a 3.59% rise using the same method.
This means we effectively know what will happen to the published Land Registry house prices five months in advance with a very high level of certainty.
Five months ago, the average price per square foot for UK home sales was £341.85, and today it stands at £346.02. Therefore, based on this calculation, UK house prices should be 1.22% higher by July than they are today. None of these points leads to a crash. Quite the opposite, they point to a resilient underlying value.
Next, let us look at other metrics that signpost towards stability.
Confidence Returning to the UK and Wolverhampton Property Markets
When we look specifically at the total number of property sales in the Wolverhampton area, the narrative of a crash falls apart even further. For example, in the last six months of 2022 (July to December), 1,268 Wolverhampton homes were sold subject to contract. In the same period in 2025, that figure was 1,528. This increase is a clear sign of market confidence. Buyers are active, and deals are being done.
(Wolverhampton WV1/2/3/4/6/10/11).
Looking at this January’s data, the UK property market has hit the ground running in 2026. There is remarkable momentum across every key metric. 96,500 new UK homes have been listed year-to-date. This figure is already 0.5% ahead of 2025 and 17.5% up on 2024. It is also 34% higher than the pre-pandemic average. This increase in choice is being met with eager demand rather than oversupply. Gross sales are healthy at 62,700 UK homes sold subject to contract. That sits 23.5% higher than 2024 and 30.6% above pre-COVID norms. Net sales are accelerating with a strong week-on-week uplift. So far, we have seen 46,100 net sales, running 35% ahead of 2024 and 40% above the 2017–19 average. This signals a highly confident and active start to the year.
The Mortgage & Employment Landscape
Another key reason for the relative resilience of Wolverhampton house prices is the environment surrounding low mortgage rates. After climbing to over 6% in late 2022, rates have stabilised and are expected to continue to fall gradually through 2026. For example, a five-year (70% Loan-to-Value) fixed-rate mortgage is available at 3.72%, or a 5% deposit first-time buyer five-year fixed-rate mortgage at 4.53%. Further reductions are likely if the Bank of England continue to cut its base rate later in the year. This shift in affordability is expected to improve buyer sentiment and support price levels.
Also crucially, the UK labour market remains strong. Unemployment is low, currently sitting at around 5.1%, and wage growth is holding steady at 4.7% per year. Also, there is little sign of the kind of financial stress that forces mass sales or repossessions, which typically precede major house price crashes.
Why 2026 is Nothing Like 2008
Another critical factor that is often overlooked is the increasing regulation of mortgage lending over the past decade. Since the introduction of the Mortgage Market Review in 2014, borrowers have had to demonstrate that they can afford repayments at interest rates significantly higher than those they signed up to.
This stress testing was designed to create market resilience, and it has been incredibly effective. Even at the height of ultra-low rates of 2020/2021, when mortgages were typically between 1.5% and 2.5%, those new borrowers had to demonstrate that they could afford repayments of 6.5% or 7%. So now, even though rates have risen, most existing homeowners coming off those rates in 2026 are already equipped to manage the change. The reckless lending of the past is simply not present in today's market.
What About Those 20% House Price Drops in London?
Of course, there are significant variations across the UK.
Some small parts of Central London (Mayfair, Chelsea and Kensington etc.), which attracted foreign investment over the last 20 years, have experienced a significant drop in house prices over the last six months (some areas more than 20% in six months).
Over the last 20 years, these ‘posh’ London areas have seen huge explosion in their house prices, way over the London and national averages because of that investment. That increase didn’t affect the rest of the London or UK property market. Now we are seeing an equally significant drop in house prices in those areas, as many of those foreign property owners are divesting of their London property. So, when the papers report, as we're sure they will in the coming months, of house price drops in Central London, I hope you will remember this.
Could a House Price Correction Still Occur?
It is not impossible, but the necessary conditions are not present. To see a genuine correction, we would need a perfect storm. We would need a sharp rise in unemployment, a sudden spike in interest rates, a collapse in mortgage availability, and a wave of forced sales. We would need another global financial crash for that to happen.
The foundation of the UK housing market is far stronger than it was in 2008 or the late 1980s. There is no subprime mortgage crisis, no rampant overborrowing, and no glut of unsold new builds.
In conclusion, although the UK housing market in 2026 faces challenges, the data indicates a direction towards stability. A correction remains highly unlikely. Most regions are expected to experience slow but steady growth, with some pricier areas dipping slightly. Overall, the narrative for 2026 is one of cautious optimism.
Ignore sensational correction forecasts; rely on the data. For buyers or sellers in 2026, strong opportunities exist, especially for those who know their local market and keep a long-term perspective. This is a stable, normalising market, far from collapse.
- Details
If you are a Wolverhampton homeowner or landlord thinking about selling your property, one of the first questions you will ask is simple, how long will it take?
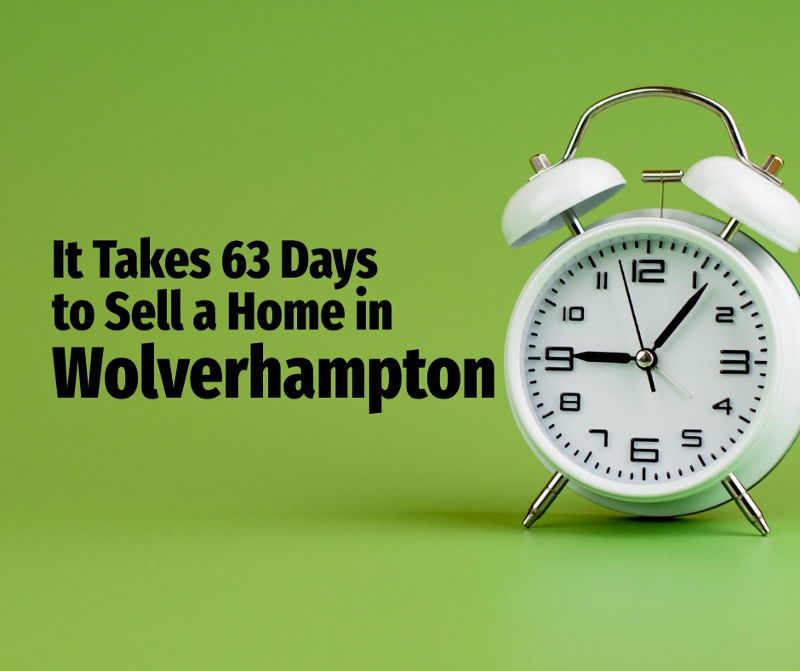
The honest answer is that it depends. Location, property type, number of bedrooms, price point and market conditions all play a part. To give Wolverhampton homeowners some clarity, we have analysed the latest data from the 536 Wolverhampton homes, building plots, commercial units and mobile homes etc, that have sold subject to contract in the last three months. This covers Wolverhampton city centre plus a one-mile radius.
Of the properties that have sold subject to contract, the overall average time from coming to market to sale agreed is 63 days. This is split down as follows by type and bedrooms.
Average time to sell a Wolverhampton property by type
- Detached homes
113 properties sold subject to contract
Average time to sale agreed, 103 days - Semi-detached homes
262 properties sold subject to contract
Average time to sale agreed, 54 days - Terraced and town houses
74 properties sold subject to contract
Average time to sale agreed, 53 days - Flats and apartments
68 properties sold subject to contract
Average time to sale agreed, 63 days
Average time to sell a Wolverhampton property by number of bedrooms
- One-bedroom homes
22 sold subject to contract
Average time to sale agreed, 39 days - Two-bedroom homes
138 sold subject to contract
Average time to sale agreed, 69 days - Three-bedroom homes
293 sold subject to contract
Average time to sale agreed, 55 days - Four-bedroom homes
69 sold subject to contract
Average time to sale agreed, 89 days - Five-bedroom homes or larger
14 sold subject to contract
Average time to sale agreed, 125 days
The message is clear. In Wolverhampton, terraced/town houses and one-bedroom homes are currently the fastest movers when it comes to property types and bedrooms.
Why do some Wolverhampton homes take longer to sell?
Selling a home is not simply about putting it on the portals (Rightmove, OnTheMarket or Zoopla) and waiting. When homes take longer to sell, or fail to sell at all, it usually comes down to two things, pricing and marketing.
Pricing your Wolverhampton home correctly
Price matters more than anything else.
Overpriced homes stand out for the wrong reasons. Buyers compare everything, and if a property looks out of step with similar homes, it is quietly ignored.
The data backs this up. Only 67.89% of Wolverhampton homes that left estate agents’ books in 2025 actually sold and completed (i.e. the homeowner moved). The remaining 32.11% were withdrawn unsold, meaning the homeowner did not move.
There are two key reasons for this. The first is unrealistic pricing at the start.
Research by Denton House using TwentyEA data shows that of the 2 million UK home sales, if a home sells within the first 25 days of coming to market, there is a 94% chance the sale will go on to complete (i.e. you move home). Yet, if it takes over 100 days to agree a sale, that completion probability falls to 56%.
Also, of the UK homes that do sell, those homes that don’t get their asking price reduced (i.e. they are realistically priced from day one) are 135% more likely to get a sale agreed on them and take a third of the time to sell and half as likely for that sale to fall through.
Setting the asking price for your home is not about settling for less, it is about creating the best conditions to achieve the most money. A property needs to enter the market at a level that attracts genuine attention from day one, because once a home lingers, value starts to leak away. That is not to say you cannot try a slightly higher asking price in the initial stages of marketing, although it's important to remember the market usually gives a clear answer within the first two weeks, through activity and feedback. That early response tells you quickly whether the price is right or needs adjusting. If it needs adjusting, do so after two or three weeks, not two or three months. In other words, the asking price gets you into the game, and what happens next is driven by how real buyers behave, not by hope or guesswork.
The role of the estate agent
The second reason is your choice of estate agent and their marketing strategy. This has a direct impact on how fast your home sells, and whether it sells at all.
Some Wolverhampton estate agents are excellent at proactive marketing, buyer follow up and honest feedback. Others are far less consistent once the board goes up.
If your agent promised regular updates, buyer feedback and a clear strategy, it is reasonable to expect that to happen. Good agents earn their value through momentum, communication and problem solving, not just by listing the home.
Exceptional photography, floor plans and video are no longer optional. Most Wolverhampton buyers first see your home on Rightmove, OnTheMarket or Zoopla, and they make a judgement in seconds.
Outdated or poor-quality images quietly kill interest. Seasonal photos are another giveaway. Snow on the ground or Christmas decorations in the summer signal how long a home has been sitting unsold.
Refreshing photography as the seasons change can make a real difference. Small improvements in presentation often lead to a noticeable uplift in enquiry.
Selling a home in Wolverhampton
Selling your home is not a tick box exercise. It is a major life decision that needs clear advice, realistic expectations and steady support from start to finish.
Understanding local data, pricing with confidence and maintaining momentum are what separate smooth moves from stressful ones.
If you are considering a move in Wolverhampton and want a grounded, data led conversation about your options, we are always happy to chat.
- Details
What this means for Wolverhampton homeowners
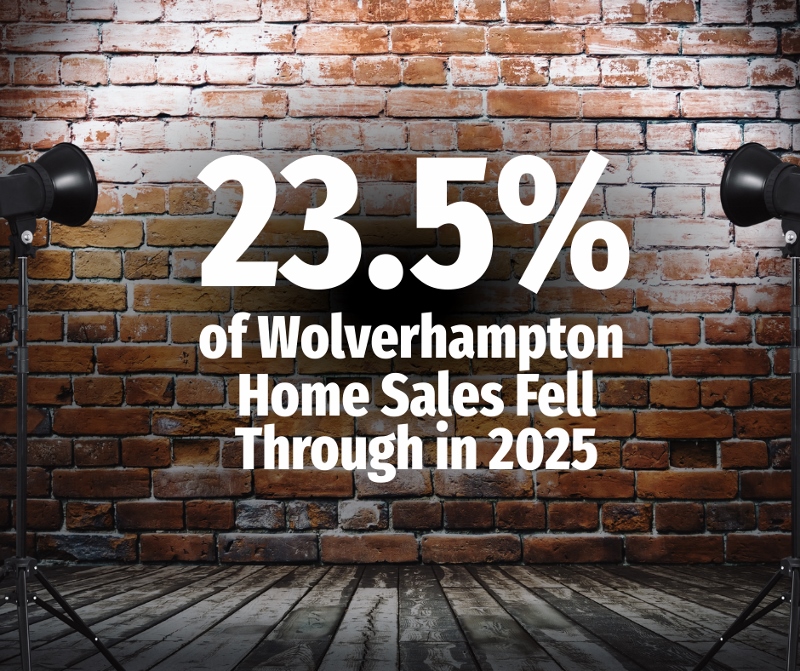
In 2025, 23.54% of agreed property sales in Wolverhampton did not complete, and this is more important than many homeowners think.
In Wolverhampton, where sales chains are often longer and buyers are more sensitive to price, this has a bigger impact. Agreeing a sale has never meant a guarantee, since properties are sold ‘subject to contract’. Still, it may surprise you that nearly a quarter of agreed sales in the city fall through. That’s a high number by any standard.
To put that percentage into context, 699 Wolverhampton households lost their move to their ‘future forever home’ because the house sale fell through.
Across the UK in 2025, the rate was 23.67%, and in the West Midlands, it was 24%. So why does this happen, and what can Wolverhampton homeowners do to reduce the risk?
Why home sales fall through
The most common reason for sales falling through is buyers changing their minds, making up just over one in three failed sales. Most of these buyers lose patience with the process, which takes on average about 19 weeks from agreeing the sale to moving in (it was eight weeks twenty years ago!). Delays often happen because legal and mortgage work takes time, or because there isn’t enough communication between agents, solicitors, mortgage arrangers, and others involved.
The next biggest reason is trouble getting a mortgage, which caused just under one in three sales to fall through. Lending rules are still strict. Even buyers who seem solid at first on their initial chat with a mortgage arranger can be affected by affordability checks, hidden debt, CCJ’s, lower valuations from lenders, or changes in interest rates before the mortgage is finalized.
Survey-related renegotiations are the next most common reason, making up just under one in five cases. Often, the survey doesn’t show anything new, but buyers use it as a reason to ask for a lower price. If sellers say no, the sale often falls through.
Chain breaks accounted for only one in eight, making them the smallest category. This challenges the long-held belief that chains are the main villain of the home-moving process.
The cost of sales falling through in Wolverhampton
In 2025, 258,000 house sales in the UK fell through. The House Buyer Bureau says the average cost to someone when a sale falls through is £3,337. That means £860 million was lost in failed house sales in 2025 alone.
For Wolverhampton, this meant home movers lost £2,332,563 to failed house sales in 2025.
The 5 ways Wolverhampton homeowners can reduce risk
There is no single silver bullet to reduce the risk of a sale falling through, but there are some steps that you can do to reduce the odds of a sale collapsing.
First, choose the right Wolverhampton estate agent. The best agent isn’t just about their fee or the price they suggest, and it’s not only about finding a buyer, it’s about making sure you actually move. The real work begins after a sale is agreed, when keeping things moving is key. Good agents manage the process closely, set clear expectations, communicate often and spot problems before they become deal-breakers. They encourage everyone to act quickly on legal, survey, and mortgage steps, because delays create doubt, and doubt can end a deal. In today’s market, where sales can fall through, you should judge an agent not just by how fast or often they sell, but by how many agreed sales actually complete.
Second, instruct a solicitor as soon as your property goes on the market with your chosen estate agent, not after you get an offer. This can save weeks of delay and reduce uncertainty. I can help with this if you need support.
Third, gather your paperwork. Giving your agent and solicitor your home’s title documents, building work certificates, gas safety certificates, lease details (if it’s a leasehold), and other property information upfront helps build buyer confidence and speeds up the process.
Fourth, set a realistic price. Pricing your Wolverhampton home correctly from the start is one of the best ways to avoid a sale falling through. Only 53.5% of UK homes listed actually sell, and if a property is on the market for more than 12 weeks, its chance of selling drops to just 14.5%. Remember, one needs to find a buyer to get to a sale agreed position. Realistic priced homes tend to sell quicker than those that are not and interestingly, how quickly you sell the home has a huge difference on whether the house sale falls through. Homes that agree a sale within 25 days have a 94% chance of completing, compared to only 56% if the sale is agreed after 100 days. Also, to back that up, properties priced right from the beginning are 135% more likely to sell, take a third of the time to sell, and are half as likely to fall through. Pricing well isn’t about pressure; it’s about speed, certainty and making your move happen.
Fifth, make sure your buyer is properly checked. Your agent should follow the law and check proof of funds, a mortgage agreement in principle, and understand the buyer’s situation, including the whole chain. These checks matter more than just the offer amount.
How the right Wolverhampton estate agent can help you move home
If you are planning to move in Wolverhampton in 2026; don’t rush, prepare instead. Take your time before putting your home on the market, not after you’ve agreed a sale. Consider instructing solicitors when you put your home on the market. These steps don’t remove all risk, but they do make a real difference.
If you want to talk through fall-through rates, what they mean locally in Wolverhampton, or how to reduce the risk on your own move, start the conversation early. Calm preparation beats last-minute panic every time.
- Details
When you look back at the average rents achieved in Wolverhampton over the last five years, from 2021 through to 2025, a clear pattern emerges. Wolverhampton saw extraordinary growth in rents as the market experienced a period of exceptional pressure post pandemic, yet in the last 12 months, is now settling into something far more measured.
That distinction matters. After several years in which Wolverhampton rents rose sharply and competition among tenants was intense, 2025 represented a shift towards balance. For many local tenants, that brings welcome relief. For landlords, it brings a different set of opportunities, provided expectations are adjusted and decisions are grounded in reality rather than headlines.
So, let us look at those last five years of rents in Wolverhampton and compare them against national figures:
- 2021 average rent in Wolverhampton: £724 per month
- 2022 average rent in Wolverhampton: £811 per month
- 2023 average rent in Wolverhampton: £941 per month
- 2024 average rent in Wolverhampton: £1,008 per month
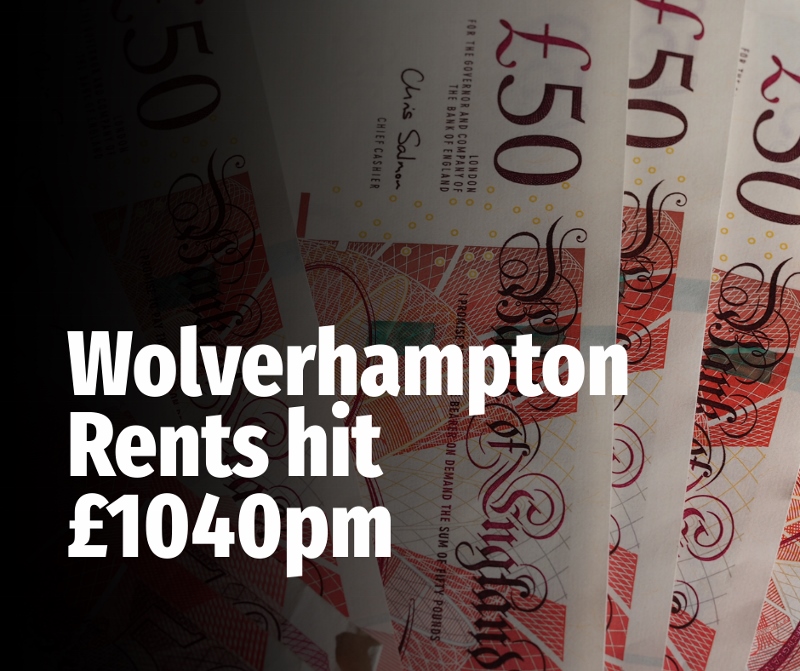
- 2025 average rent in Wolverhampton: £1,040 per month
A rise of 43.6% in 5 years.
Set against the national picture:
- 2021 UK average rent: £1,390 per month
- 2022 UK average rent: £1,549 per month
- 2023 UK average rent: £1,723 per month
- 2024 UK average rent: £1,813 per month
- 2025 UK average rent: £1,838 per month
A rise of 32.2% in 5 years.
What this shows is that while rents in Wolverhampton have risen significantly since 2021, the pace of growth has moderated during the last twelve months. That moderation is not a sign of weakness. It is a sign that the market is once again absorbing supply and demand more evenly and coming more into balance.
Why the Wolverhampton rental market has cooled without going cold
After years of intense pressure, conditions have eased. Competition between tenants is lower, supply has improved and thus rent growth has slowed.
On new lets nationally, annual rent inflation is now running at 1.4%, the slowest pace seen in around seven years. Average rents nationally sit at £1,838 per month, rising at around a third of the pace of wages (currently 4.6%). That is an important point. It signals that rents are no longer racing ahead of incomes, helping stabilise tenancies and reduce churn.
The reasons behind this shift are structural rather than temporary. Tenant demand is down by roughly a fifth compared with last year, according to Zoopla. Net migration has fallen sharply from the exceptional levels seen earlier in the decade, easing one of the biggest drivers of rental pressure. At the same time, improved mortgage availability has enabled more renters to enter home ownership, releasing additional rental stock back into the market.
This is not a market losing momentum. It is a market regaining equilibrium.
What supply looks like in Wolverhampton, year by year
Supply is the other half of the equation, and it is where many landlords misread the local picture.
Looking at the number of rental homes coming onto the Wolverhampton market:
- 2021 new rental listings in Wolverhampton: 2,766
- 2022 new rental listings in Wolverhampton: 2,932
- 2023 new rental listings in Wolverhampton: 2,680
- 2024 new rental listings in Wolverhampton: 2,746
- 2025 new rental listings in Wolverhampton: 3,346
Compared with the national trend:
- 2021 UK new rental listings: 1,353,253
- 2022 UK new rental listings: 1,261,296
- 2023 UK new rental listings: 1,243,095
- 2024 UK new rental listings: 1,240,194
- 2025 UK new rental listings: 1,356,004
What becomes apparent is that supply has improved locally over the last year or so, broadly in line with national patterns, but without overshooting demand. That is a crucial distinction. Wolverhampton has not suddenly become oversupplied; it has simply moved away from the shortage conditions of the last couple of years.
Why this is good news for Wolverhampton tenants & sensible news for landlords
For Wolverhampton tenants, the benefits are obvious. More choice, fewer bidding wars, and less pressure to make rushed decisions. That leads to longer, more stable tenancies and better outcomes on both sides.
For Wolverhampton landlords, it is my opinion the opportunity lies in one’s shifting focus. The most successful landlords are rarely those who chase the maximum headline rent every year. They are the ones who prioritise a balance between occupancy, tenant quality, and long-term income without any hassle.
In a calmer Wolverhampton rental market, pricing accurately matters more than pricing aggressively. Overstretching on rent is more likely to result in void periods, which erode returns far faster than a modest increase improves them or attracts a certain type of tenant that might not be as reliable in paying the rent or keeping the property in good condition.
Stable prices strengthen the investment case for Wolverhampton buy-to-let
Another factor often overlooked is house price stability. A stable sales market in Wolverhampton makes it easier for landlords to plan, whether that is buying, refinancing or rebalancing a portfolio.
When prices are not swinging wildly, investors can assess opportunities based on fundamentals rather than speculation. Yield, tenant demand and running costs come back to the front. For landlords considering entering or expanding in Wolverhampton, that stability reduces risk and supports more confident decision-making.
What a professional approach looks like in 2026 and beyond
As the Wolverhampton rental market normalises, a more professional approach becomes essential.
Properties that are well presented, well maintained and sensibly priced continue to let well in a timely manner. Clear communication around rent reviews helps maintain trust. Landlords who understand their local data, rather than relying on national headlines, are better placed to make informed decisions.
This is also a market that rewards compliance and good management. As standards rise across the sector and with the new rental legislation already introduced, (plus what is on the horizon with the Renters Rights Act) those already operating properly will find the transition far smoother than those who have relied on scarcity to mask weaknesses.
Looking back at rent data from 2021 to 2025, the long-term trend remains positive. What has changed is the pace, not the principle.
For Wolverhampton landlords, 2025 marks a return to a market that rewards patience, preparation and realism. Tenants benefit from greater fairness and choice. Landlords benefit from stability, predictability and the ability to build sustainable income over time.
In short, a calmer rental market is not something to fear. For those taking a long-term view in Wolverhampton, it may well be exactly the environment in which sensible decisions deliver the best results.